Simplified Pressure, Temperature, and Airflow Diagnostics
Diagnosing the performance of an HVAC system is simple if you master the art of profiling. Profiling consists of taking a series of measurements across a system and subtracting to quickly find the cause of the system defect. Let’s take a look at how you can add profiling to your daily diagnostic routine.
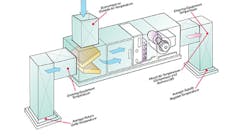
You can profile an HVAC system by taking a series of temperature, pressure, or airflow readings across it, and recording your numbers on a system schematic. Subtract the readings from one point in the system to the next. Any change in temperature, pressure, or airflow is then easy to recognize. Studying the profile makes system defects apparent where they might not have been visible by any other means.
For example, measure the temperature at a return grille -- say it is 72F. Next, measure the return air temperature where air enters the equipment -- say it is 62F. Subtract 72F from 62F to find a 10F degree difference through the return duct. Profiling enables you to “see” a 10-degree temperature loss through the return duct. This is far in excess of an acceptable duct loss of 1-2 degrees.
Once the defects become apparent, solving the system performance problem becomes clear. This test method works just as well on residential systems as it does on commercial systems.
Pressure Profiling
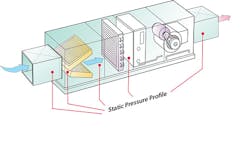
For years air balancers used profiling as a reporting method for commercial HVAC equipment. Primarily, this diagnostic technique was used to analyze the heart of the commercial system. By plotting pressure throughout the entire system, you can easily evaluate system performance.
Profiles quickly gather all the necessary test data to calculate system pressure drops. As you enter pressure measurements on the system graphic, from one end to the other, you can subtract readings to find the pressure drops over any component or section of the system.
Subtract the pressure after a coil from the pressure before the coil and the difference is the pressure drop over the coil. In a residential furnace the ideal budget for the coil is no more than 40% of the fan rated total external static pressure. If it’s more than that, “Houston, we have a problem,” and a solution to the problem becomes the next step for you to take.
Calculate the pressure drops over air filters. Ideally no more than 20% in furnaces and up to 50% in single-piece air handlers should be taken by the filter (because there’s no external coil pressure drop to account for in the pressure budget of an air handler). If the pressure drop is under budget, move on, if not, a solution must be created.
You can also evaluate the pressure drop of any other system component. Duct system pressure drop should not exceed 40% of fan rated pressure. A single duct fitting or transition should rarely exceed 5% of rated fan pressure.
You’ll be amazed by the effectiveness of pressure profiling in your daily system diagnostic routines.
Temperature Profiling
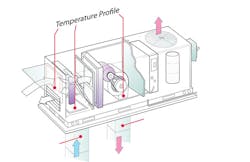
The same principles apply to temperature diagnostics when profiling as they do to measuring and recording system pressures.
Use a straight line system schematic to gather the temperatures from one end of a system to the other. Then subtract one temperature to another and compare the results to accepted industry standards.
Ideally, the temperature rise over a gas-fired furnace should typically be 35 to 65 degrees. Since many of you have mastered combustion testing and BTU measurement, you know that unless you’re near the top of that scale, your hopes of system performance anywhere near 90% are pretty slim.
Likewise, if a temperature profile shows a dry bulb ∆T over a cooling coil of only 13 degrees, you have identified the culprit in your investigation.
Duct losses are easily identifiable using temperature profiling. If the supply plenum measures 130 degrees and the farthest supply register air temperature measures only 120 degrees, the system is experiencing some significant thermal losses.
The same hold true for the other end of the system. If you read 70 degrees at the average return grille and the temperature drops to 60 degrees by the time it reaches the return plenum, you have a 10 degree temperature loss through your return duct. It’s time to whip out your balancing hood or anemometer and chase down some serious return duct leaks.
Profiling return and outside air quickly isolates the load a fresh air duct adds to a building. The temperature profiling list of great diagnostic tests goes on.
Airflow Profiling
Measuring airflow at a number of points throughout a system will reveal some real winners and losers. Find fan airflow by measuring static pressure and plotting fan airflow from the manufacturer’s fan tables, or by performing a traverse at the return drop. Next, measure the airflow at the return grilles. Fan airflow minus return grille airflow helps isolate return duct leaks.
Measure the airflow at the registers on the supply side of the system. Subtract register airflow from the fan airflow to find supply duct leakage as well. If the fan is moving 1600 CFM and only 1200 is exiting the supply registers; 1600 CFM -1200 CFM reveals a 400 CFM supply duct leak.
To summarize, take a series of measurements across your systems, and then organize your test data on a sketch of the system and subtract as described here to identify the system changes. Finally, step back and take a fresh look at system performance from a new perspective and take diagnostics to a new level.
Rob “Doc” Falke serves the industry as president of National Comfort Institute, an HVAC-based training and membership organization. If you're an HVAC contractor or technician interested in a free Profiling Report Form you can use in the field, contact Doc at [email protected] or call him at 800-633-7058. Go to NCI’s website at nationalcomfortinstitute.com for free information, articles, and downloads.
About the Author
Rob 'Doc' Falke
President
Rob “Doc” Falke serves the industry as president of National Comfort Institute an HVAC-based training company and membership organization. If you're an HVAC contractor or technician interested in a building pressure measurement procedure, contact Doc at [email protected] or call him at 800-633-7058. Go to NCI’s website at NationalComfortInstitute.com for free information, articles and downloads.


