If you are like me, then you dread the annual sales forecasting process. First, forecasts are never correct — so why bother? Furthermore, it requires a lot of work. Finally, the macro-economic factors are confusing and difficult to apply. Yet, they are necessary for every business. Sales forecasts are required for overall business planning as well as sales budgets and, done properly, can represent a realistic, reasonable projection of how the business will or should perform.
The sales forecast essentially looks at sales from two perspectives: market size and market share. In business terms, that means how much sales is out there and how much is yours. Factors outside the company's control, such as the economy, technology and innovation, typically determine market size. Market share is your portion of the business and is determined by factors more directly related to actions by your business.
Here is a step-by-step outline to assist you and make the process as straightforward and meaningful as possible. You may choose to perform the process separately for different market segments such as commercial, residential, new and replacement and then add them together. There is no right or wrong approach; it all depends on what you are most comfortable doing and what is most fitting for your business.
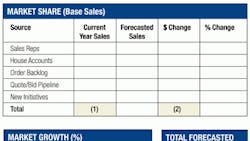
A. Determining Market Share
-
Account Review — The sales manager and sales representative should conduct an in-depth review of every account. Compare sales activity to the previous year's sales as well as previous year's budget if available. A plan should emerge as to the projected sales based upon current and existing conditions. Be sure to include house accounts. Then, add all the account plans together. This provides the baseline for the forecast.
-
Analysis of Order Backlog/Sales Pipeline — All businesses have sales order backlogs. Changes in the backlog reflect additional business for the coming year. For example, if the typical backlog is $750,000, and the company is carrying a backlog of $1,250,000, you can expect to ship an extra $500,000 of orders. Likewise, companies often submit bids or quotes for projects. Again, there is a normal percentage of won bids. If the bid pipeline is higher (or lower) than normal, this also should be taken into consideration.
-
New Initiatives — Establish a listing of new company initiatives along with the expected impact upon sales. Examples include new product lines, products, changes in inventory, growth/reduction in sales force and improved delivery.
B. Market Growth
-
Customers — Senior management, usually the president along with the vice president of sales, should contact the top key customers and discuss their outlook. This is different from the account-by-account review. You are trying to obtain their assessment of the overall market and their estimate of growth.
-
Distributors — Competing industry distributors can share a lot of information. If the distributors are located in different regions of the country, they tend to be even more open with sharing information because they are not competing. Finally, there are distributors from related industries. For the HARDI distributor, that may mean distributor industries such as plumbing supply and flooring. You may sell different products, but the driving force of your overall business includes many of the same economic factors and customer projects.
-
Suppliers/Vendors — Industry suppliers often are multibillion-dollar companies that have the resources to perform in-depth market research and analysis. Companies such as Carrier, Johnson Controls and Trane (Ingersoll Rand) actually present this information at their investor conferences, and the information is accessible on their websites. They always discuss sales as well as industry forecasts and trends. People can dial in to listen and transcripts are usually available on the Internet. Also, ask your sales representative to get you information.
-
Big Box Retailers — If you are selling into the residential or lower-end commercial segment, then chain stores such as The Home Depot and Lowe's are good indicators of market activity. As with your suppliers, go to their websites and review their quarterly reports for their assessment of market growth and trends.
-
Macro-economic Indicators — Some businesses can directly correlate their business activity to specific macro-economic indicators such as residential remodeling or commercial building. There are specific economic indexes for these, such as the National Association of Home Builders, Remodeling Market Index and American Institute of Architects Architecture Billings Index (ABI).
-
Trade Information — Trade groups and magazines typically provide industry-specific information such as the HARDI Jan. 18th webinar on regional forecasting. These tools can be extremely useful because they do most of the work for you.
What to Do with the Information
A few simple charts will help assemble the information. Use the charts below to evaluate actual performance throughout the year. Remember, the forecast is part of the company's sales plan.
Note, there is usually some overlap between forecasted sales and market share growth. You will need to manually adjust for this. Finally, there is one last source that you must take into account — your experience and intuition. Most of you have been in the industry for much of your professional lives and have developed a fine intuition for the industry. Any forecast must pass your own smell test for what is reasonable and achievable.
Jeffrey N. Klar is president of JIA Information Management, a provider of CFO, management consulting and advisory services to businesses with annual sales of $10 to $50 million. Klar's experience includes more than 20 years managing manufacturing and distribution businesses. To learn more, visit JIA Information Management at www.jiamanagement.com or contact Klar at 201/338-0470 or [email protected].
