Industry Updates

WOMEN OF WORKING AGE
- There were 125,941,000 working age women (16 years of age and older) in the U.S. in 2012 – 72,648,000 were in the labor force.
-
Of the close to 126 million women of working age:
- 98,938,000 were White
- 16,400,000 were Black or African American
- 6,815,000 were Asian
- 18,324,000 were of Hispanic or Latino ethnicity
- Between 2010 and 2020 the number of women in the labor force is expected to increase at a rate of 0.7%, compared to 0.6 % for men.
JOBS
74 million
The number of females 16 and older who participated in the civilian labor force in 2012. Women comprised 47.4 percent of the civilian labor force in 2012.
Source: U.S. Census Bureau, 2012 American Community Survey, DP03
41.6 percent
Percent of employed females 16 and over in 2012 (annual average) who worked in management, professional and related occupations, compared with 34.7 percent of employed males in the same year (annual average).
INDUSTRIES
The three industries with the largest percentage of total employed women

36.3%
Education and
Health Services


The three industries with the smallest percentage of total employed women


LABOR FORCE PARTICIPATION RATES

Women’s participation in the labor force accounted for 57.7% of the working age women population in 2012, compared to 70.2% participation rate for men.
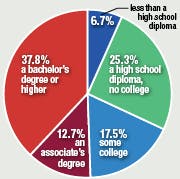
EDUCATION
Percentage of the 62,413,000 women 25 years of age and older participating in the labor force in 2012 who had: