SupplyHouse's New HVAC Stress Report Highlights Top Service Demand Cities
Key Highlights
- Proper HVAC sizing, installation, and maintenance are crucial in high-stress markets to ensure system durability and efficiency.
- Climate factors significantly influence service calls, replacement cycles, and equipment selection for HVAC contractors.
- Regions with extreme weather require durable systems and proactive maintenance to mitigate faster wear and operational challenges.
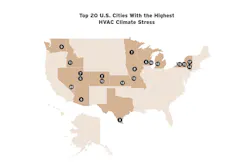
MELVILLE, New York — Minneapolis ranks as the most weather-stressed U.S. city for HVAC systems, according to a new HVAC Stress Index from SupplyHouse that measured climate-driven equipment demand across 98 metro areas.
The report analyzed six years of National Oceanic and Atmospheric Administration data from 2020 through 2025. Rankings were based on four factors tied to HVAC workload: heating degree days, cooling degree days, days at or above 90° F, and days at or below 32° F.
"We work with contractors every day, and one thing we hear constantly is that the standard climate zone maps don't tell the full story," says Jay Yglesias, product support lead at SupplyHouse. "A contractor in Denver knows their customers' systems are working harder than someone in Charlotte, but there wasn't a single, data-backed resource that quantified that difference in a way that was actually useful on the job. Climate zones were designed for building codes and energy efficiency standards, not for predicting system wear, service frequency, or equipment lifespan.
"We wanted to build something that spoke the language contractors actually use, heating degree days, cooling degree days, extreme heat days, freezing days, and roll them into one index that answered a simple question: which cities are genuinely punishing HVAC equipment the most?" he continues. "Once we started pulling six years of NOAA data across 98 metros, the picture became really compelling."

Minneapolis placed first due to the highest annual heating demand in the study at 7,850 heating degree days and an average of 142 freezing days per year. Denver ranked second, driven largely by cold-weather demand, while McAllen, Texas, ranked third because of sustained cooling pressure and extreme heat.
"Denver at No. 2 raised some eyebrows internally, because people tend to think of it primarily as a ski town with mild summers," Yglesias says. "But when you layer in 151.5 freezing days a year, and nearly 7,000 heating degree days, it becomes clear that heating systems there are under sustained, serious pressure, and the high-altitude terrain in the surrounding NOAA division likely adds to that. Denver contractors are dealing with one of the most heating-stressed environments in the country."
McAllen recorded the most days above 90°, averaging 200.7 annually. That means cooling systems operate under heavy load for more than half the year. Miami led the nation in cooling degree days at 4,646, followed by McAllen and Cape Coral, Florida.
"McAllen, Texas cracking the top three was also notable," Yglesias notes. "Most people think of Phoenix first when they think of extreme heat, but McAllen has more days above 90°F than any other metro we studied, over 200 days a year. That's more than half the calendar year with an air conditioner running under peak load conditions. The cooling stress there is relentless in a way that even Phoenix doesn't quite match."
On the heating side, Minneapolis led the rankings, followed by Spokane, Washington, and Denver. The report noted that these markets place long seasonal demands on furnaces and heat pumps with limited downtime.
At the other end of the rankings, San Francisco placed last at No. 98, making it the least HVAC-stressed major city studied. The city averaged fewer than five extreme heat days annually and zero freezing days.
For HVAC contractors, the findings highlight how local climate conditions can influence service calls, maintenance schedules, replacement demand, and equipment selection. Systems in high-stress markets often run longer, cycle more frequently, and experience faster wear.
"Stress data is essentially a risk map for your service business," Yglesias says. "If you're operating in a top-10 stress city, you have a data-backed argument for why semi-annual maintenance agreements, not annual, make sense for your customers. A system in Minneapolis that's pulling 7,850 heating degree days a year is experiencing wear equivalent to what a San Francisco system might see over several years. That changes the math on inspection intervals, filter replacement, and component monitoring."
Stress data also helps contractors prioritize customer base segments by risk level. For example, an older system in a high stress city will have a higher risk of a breakdown than a new system in a moderate climate. "Stress data lets you price and prioritize accordingly, and more importantly, it gives you a credible, third-party-backed conversation to have with customers about why proactive maintenance is worth the investment in their specific market," Yglesias.
Yglesias also notes that contractors in high-stress climate markets must take a more strategic approach to design, equipment selection, and installation because systems operate under far greater seasonal strain. He cautioned against undersizing equipment purely in the name of efficiency, noting that in cities such as Minneapolis or Denver, even slightly undersized systems can run nonstop during peak weather and accelerate wear. At the same time, oversizing can create short cycling issues, so finding the right balance is critical. He also recommended specifying higher-reliability equipment, stronger warranties, and technologies such as variable-speed compressors and ECM motors that reduce constant full-load cycling.
On the installation side, he said one of the biggest mistakes contractors make is treating the job as a one-time transaction rather than the beginning of a long-term performance relationship. Minor installation shortcuts that may go unnoticed in mild climates often become immediate service problems in places like Phoenix or Minneapolis. He also warned contractors to fully account for building envelope factors such as duct losses, infiltration, and insulation gaps in cold climates, and to properly address latent load and humidity control in hot-humid markets like Miami or Houston, where temperature alone does not define comfort.
The methodology weighted heating degree days and cooling degree days at 30% each, with extreme heat days and freezing days each accounting for 20% of the final score. Data was sourced from National Oceanic and Atmospheric Administration climate divisions and station records.
"Geography is a major variable in how hard your customers' equipment works, and most of the industry isn't accounting for that as rigorously as it should," Yglesias says. "The difference between a system in San Francisco and a system in Minneapolis isn't just a matter of degree; it's an entirely different operational reality in terms of runtime hours, thermal cycling, component fatigue, and replacement frequency. For contractors, that means the conversations you're having with customers in high-stress markets need to reflect that reality. The sizing decisions, the equipment you're specifying, the maintenance intervals you're recommending, the service agreements you're selling, all of it should be calibrated to the actual stress your local climate places on mechanical systems, not just generic industry guidelines written for an average that doesn't exist anywhere."
About the Author
 Nicole Krawcke
Nicole Krawcke
Nicole Krawcke is the Editor-in-Chief of Contracting Business magazine. With over 10 years of B2B media experience across HVAC, plumbing, and mechanical markets, she has expertise in content creation, digital strategies, and project management. Nicole has more than 15 years of writing and editing experience and holds a bachelor’s degree in Journalism from Michigan State University.